 SlopeSketch
Linear Regression
Calculator
Fit a straight line. Understand the relationship.


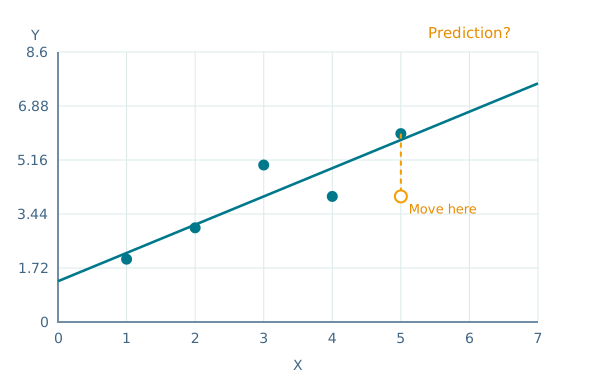
From data to a fitted line.
Your data
| X | Y |
|---|
● Observed data━ Fitted line
Linear regression equation
Slope
Intercept
R²
How the fit is calculated
Ordinary least squares minimizes the sum of squared vertical residuals. Slope = Σ[(x−mean x)(y−mean y)] / Σ[(x−mean x)²]; intercept = mean y − slope × mean x.
How it works.
A clear result in three steps.
1
Enter paired values
Type your X and Y data or paste a dataset.
2
Fit the line
We calculate the best fitting straight line.
3
Read the results
Read the equation, slope, R² and make predictions.
Try an example:
Questions, Answered.
What does the slope mean?
The fitted line changes by the slope for each additional x-unit.
What does R² tell me?
R² measures the fraction of observed y variation explained by this fitted line. It does not prove causation.
Does a relationship prove causation?
No. Other factors, selection and chance can explain an association.
Can I predict beyond my data?
Yes, but that is extrapolation. The relationship may not continue outside the observed range.

FREE PDF GUIDE
Understand the story behind the line.
- Fit your first regression line
- Read slope and R²
- Check residuals and prediction limits